

Margin Is Freedom
How Capital Efficiency and Sovereign Pricing Drive Sustainable Corporate Scale

Why the Quality of Growth Determines Organizational Control
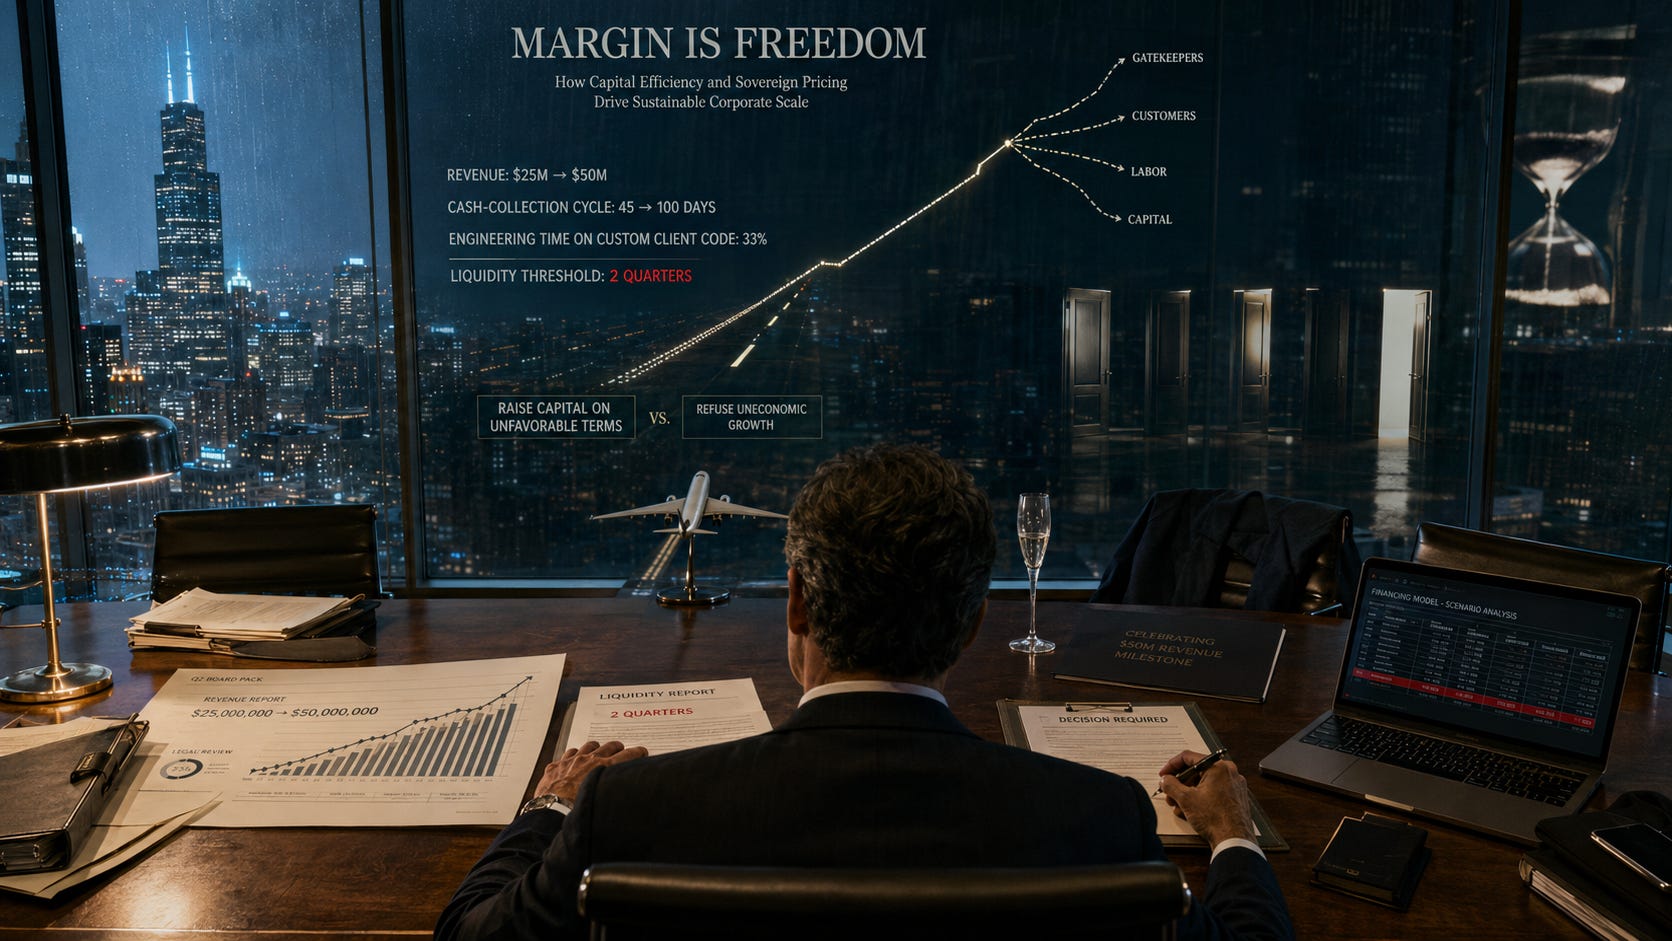
Consider a composite software company drawn from recurring patterns across growth-stage technology and services businesses. Year-over-year revenue has just doubled, crossing $50 million for the first time. On a slide projected at the front of a quiet boardroom, the line on the chart pointed up and to the right at an angle that looked like a runway.
In the CFO’s corner office two doors down, the atmosphere was entirely different. The period between sales spending and actual cash collection had expanded from 45 days to nearly 100 days. Software engineers spent roughly a third of their time writing custom code for individual clients, and two of the firm’s largest accounts were threatening to cancel unless they received dedicated support engineers.
The CFO warned that the business would breach its minimum liquidity threshold within two quarters. The sales chief insisted that refusing the next wave of enterprise contracts would signal weakness to the market, while engineering warned that accepting them would permanently break the product roadmap. So the CEO faced a sharp choice between executing an emergency capital raise on unfavorable terms or refusing additional growth to repair the operational core. Top-line revenue had doubled, yet management had far less control over the company’s next decision than it did at half the size.
The question is simple: If we doubled revenue under our current operating model, would the company become stronger, or would it merely become busier?
This is the central paradox of modern growth. A company can double its top line and still actively destroy economic value, whereas another business can invest aggressively, show modest current margins, and build an extraordinarily resilient asset. The difference almost never lies in the total volume of sales; it lies in the underlying friction of that growth.
Operators are realizing a deeper truth: margin is not merely what remains after expenses are deducted on an income statement. Margin is a measure of organizational sovereignty.
Why This Matters Now
Margin matters because it finances optionality, but corporate sovereignty ultimately depends on the number and quality of alternatives management retains. Corporate sovereignty is controlled interdependence: knowing where external power sits, preserving alternatives where feasible, and preventing any single outside actor from determining survival. Cash reserves, customer diversity, intellectual property, and replaceable counterparties can preserve strategic freedom just as effectively as high reported margins. Conversely, a company can report modest current margins while increasing sovereignty if investment expands its future alternatives, reduces concentration, or lowers switching barriers. Margin gives management room to choose, but it does not ensure that management chooses well. Sovereignty measures the availability of credible options, whereas governance determines whether management selects among them intelligently.
For much of the post-2008 period, borrowing costs and discount rates across major developed markets remained unusually low, concealing this contradiction. For many companies outside developed capital markets, expensive and unreliable financing was never an exception; it was the normal operating condition. In low-rate hubs, however, companies bought customers at a loss, hired far ahead of demand, and excused weak unit economics as the temporary cost of scale. Scale, so the argument went, would fix everything. That monetary regime has ended, but the shift taking place is not merely that investors now prefer profit to volume.
A company surrenders its sovereignty in four distinct ways, each defined by an exposure indicator and an exposure-reduction barrier: the cost, time, operational disruption, and revenue risk required to reduce or replace that exposure.
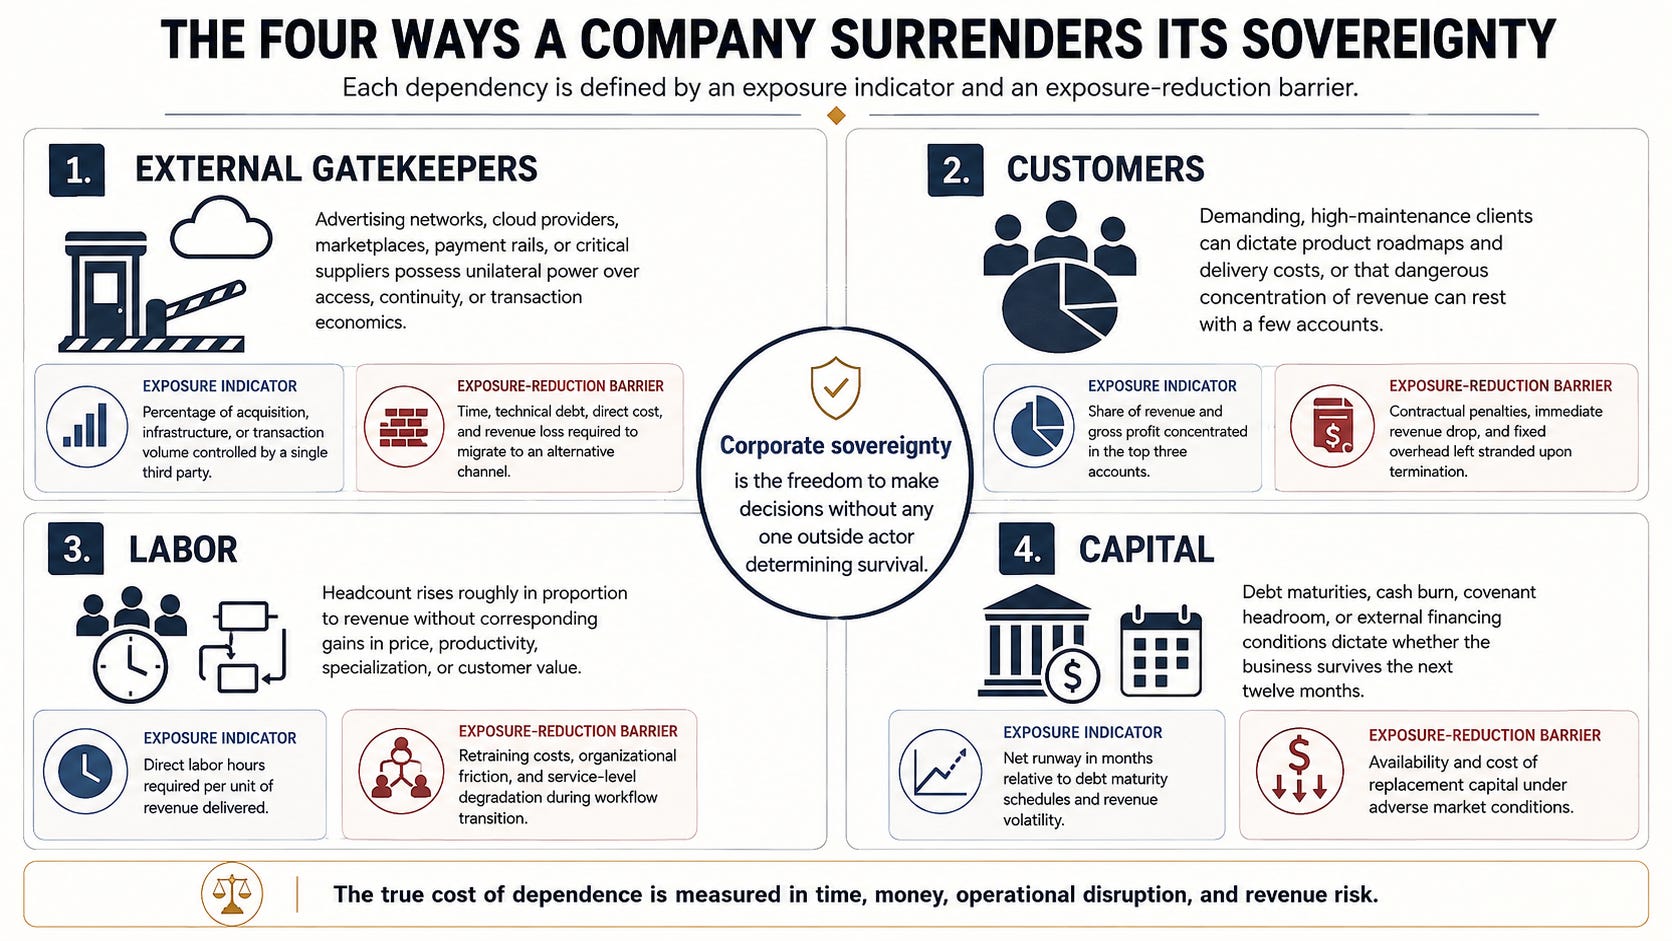
1. External Gatekeepers
Advertising networks, cloud providers, marketplaces, payment rails, or critical suppliers possess unilateral power over access, continuity, or transaction economics.
Exposure Indicator: Percentage of acquisition, infrastructure, or transaction volume controlled by a single third party.
Exposure-Reduction Barrier: Time, technical debt, direct cost, and revenue loss required to migrate to an alternative channel.
2. Customers
Demanding, high-maintenance clients dictate product roadmaps and delivery costs, or a dangerous concentration of revenue rests with a few accounts.
Exposure Indicator: Share of revenue and gross profit concentrated in the top three accounts.
Exposure-Reduction Barrier: Contractual penalties, immediate revenue drop, and fixed overhead left stranded upon termination.
3. Labor
Headcount must rise roughly in proportion to revenue without corresponding gains in price, productivity, specialization, or customer value.
Exposure Indicator: Direct labor hours required per unit of revenue delivered.
Exposure-Reduction Barrier: Retraining costs, organizational friction, and service-level degradation during workflow transition.
4. Capital
Debt maturities, cash burn, covenant headroom, or external financing conditions dictate whether the business survives the next twelve months.
Exposure Indicator: Net runway in months relative to debt maturity schedules and revenue volatility.
Exposure-Reduction Barrier: Availability and cost of replacement capital under adverse market conditions.
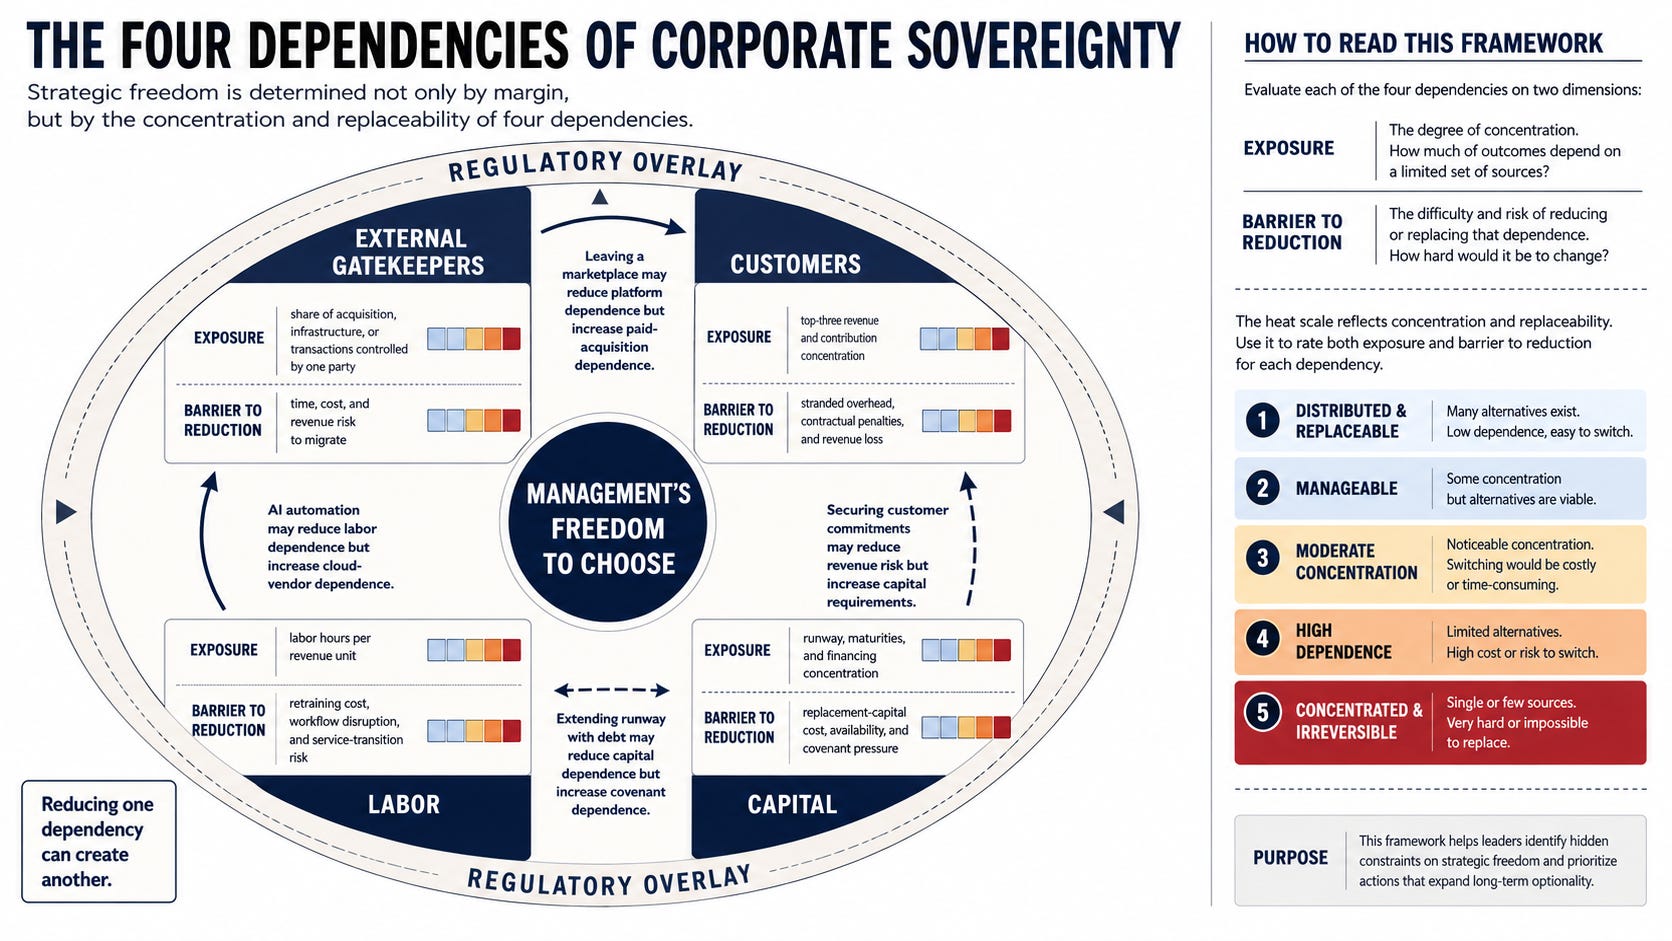
Regulatory Overlay
Regulation sits above these four operating dependencies as an external sovereign constraint capable of overriding management’s choices across pricing, capital requirements, product design, data access, and market entry. Regulatory rules alter both capital intensity and gatekeeper access across financial services, healthcare, energy, telecommunications, and transportation.
Quick-Start Executive Triage
Before building a full measurement architecture, leadership teams should evaluate four primary diagnostic questions:
Gatekeepers: Does a single advertising channel, cloud provider, marketplace, or supplier control enough customer access or production capacity to alter your business if terms change unilaterally?
Customers: Would losing your top three client accounts eliminate enough direct contribution margin to threaten fixed-cost coverage?
Labor: Is delivery headcount expanding nearly as fast as top-line revenue growth?
Capital: Could shifts in external financing conditions or revenue dips force an emergency capital raise within twelve months?
Prioritization Rule: Begin with the dependency most likely to force a major decision soonest, not necessarily the one with the largest nominal exposure. When two dependencies could force action within the same period, prioritize the one with higher irreversibility or weaker alternative substitutes.
Margin is the financial evidence that a company has retained the freedom to choose. Operationally, a sovereign company can lose a major customer without material damage, change a supplier without breaking its model, withstand a downturn without emergency financing, reject uneconomic contracts, and grow without proportional additions of low-productivity labor.
Margin is evidence of autonomy, but it is not absolute proof of it. A company with 70% gross margins can still have very little negotiating freedom if one customer represents half its revenue, or if one cloud provider can reprice its infrastructure overnight. High current margins can also be temporary, produced by scarcity, deferred maintenance, or cost cuts that degrade future capacity. Sovereignty depends not only on the amount of margin a company earns, but on how concentrated, durable, and independently generated that margin is.
Reducing one dependency can sometimes increase another. Leaving a third-party marketplace to build direct distribution may lower gatekeeper exposure, but direct customer acquisition costs may double in the first year, depressing short-term gross margins and increasing initial capital intensity.
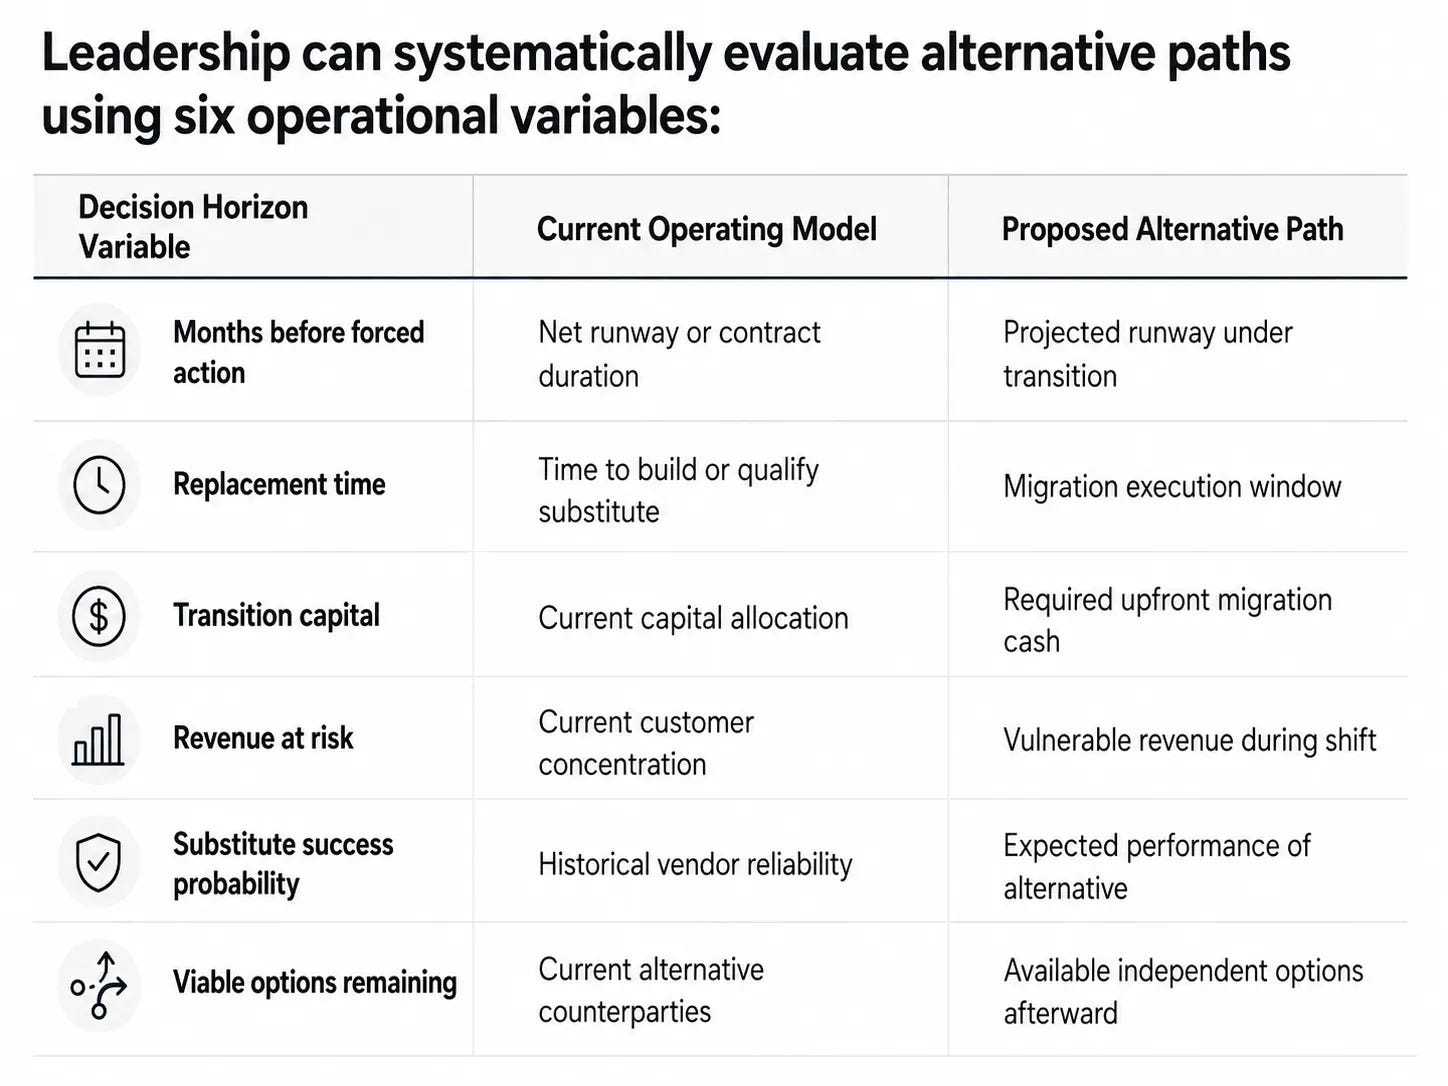
To navigate these tradeoffs, operators must evaluate the risk-adjusted decision horizon: the period during which management can choose among credible alternatives before a customer, supplier, platform, regulator, or financing event forces action on unfavorable terms.
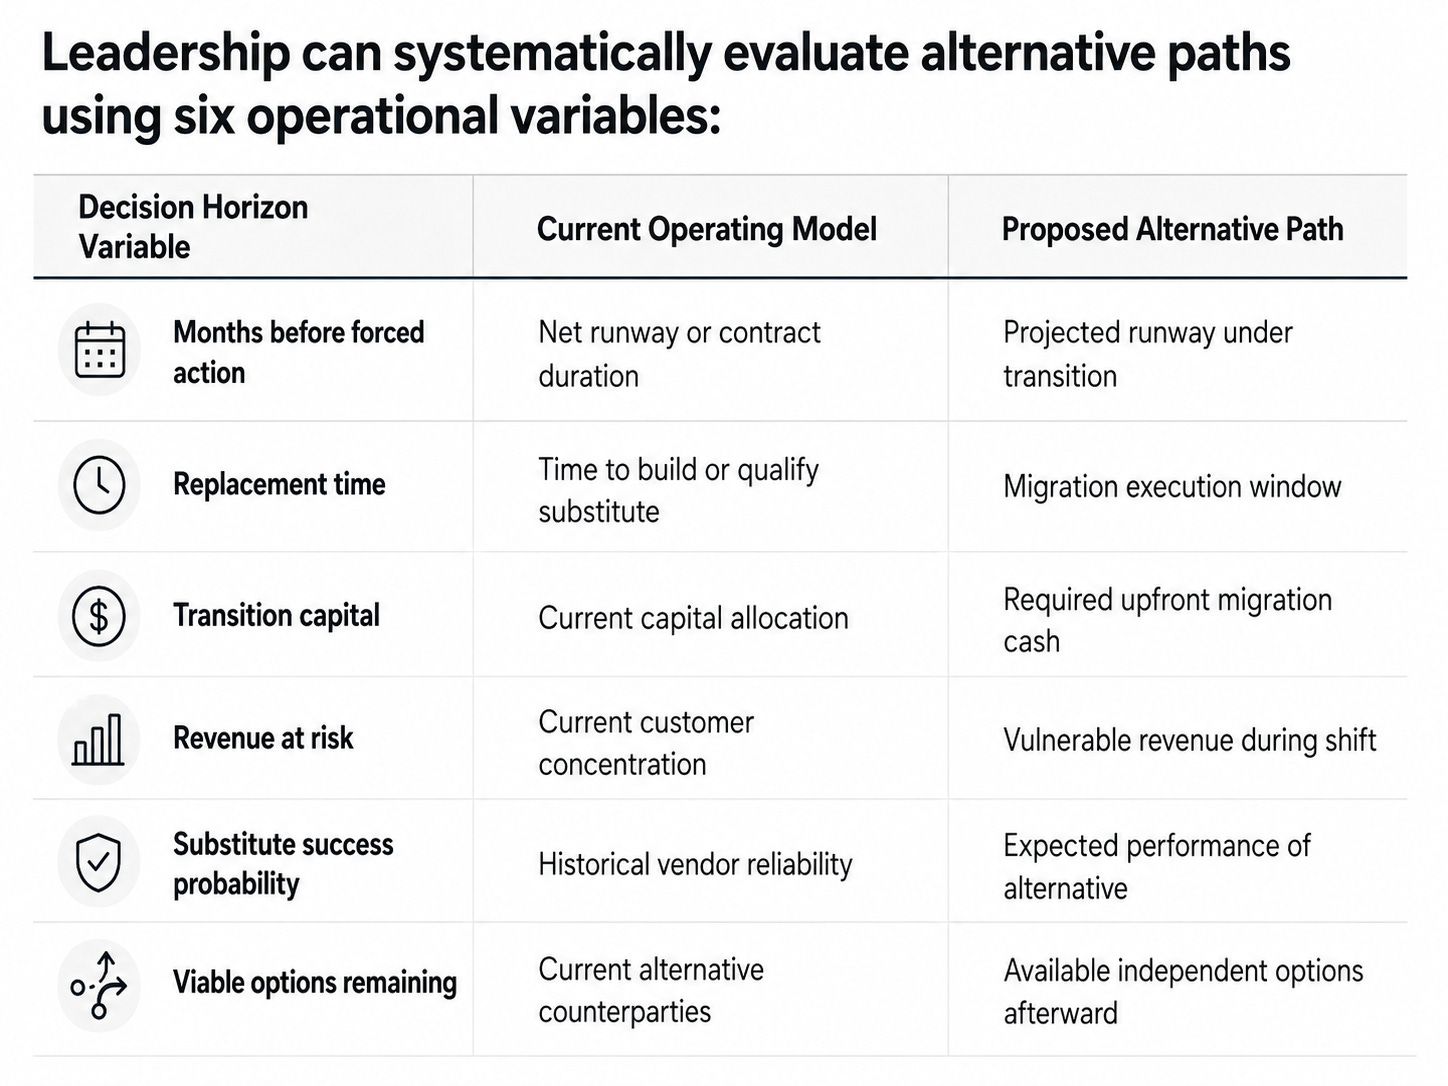
When comparing competing dependencies, leadership should follow a clear decision sequence:
Measure the current dependency exposure and its reduction barrier.
Estimate the new dependency created by the intervention, such as support automation reducing labor dependence while increasing AI-vendor or cloud reliance.
Compare net transition costs and reversibility.
Assess guardrail risks to service quality or customer satisfaction.
Choose the option that extends the risk-adjusted decision horizon most effectively.
What Is Strategy? It’s a Lot Simpler Than You Think
Revenue Quality
Top-line revenue can conceal more than it reveals when viewed without contribution, retention, and cash conversion.
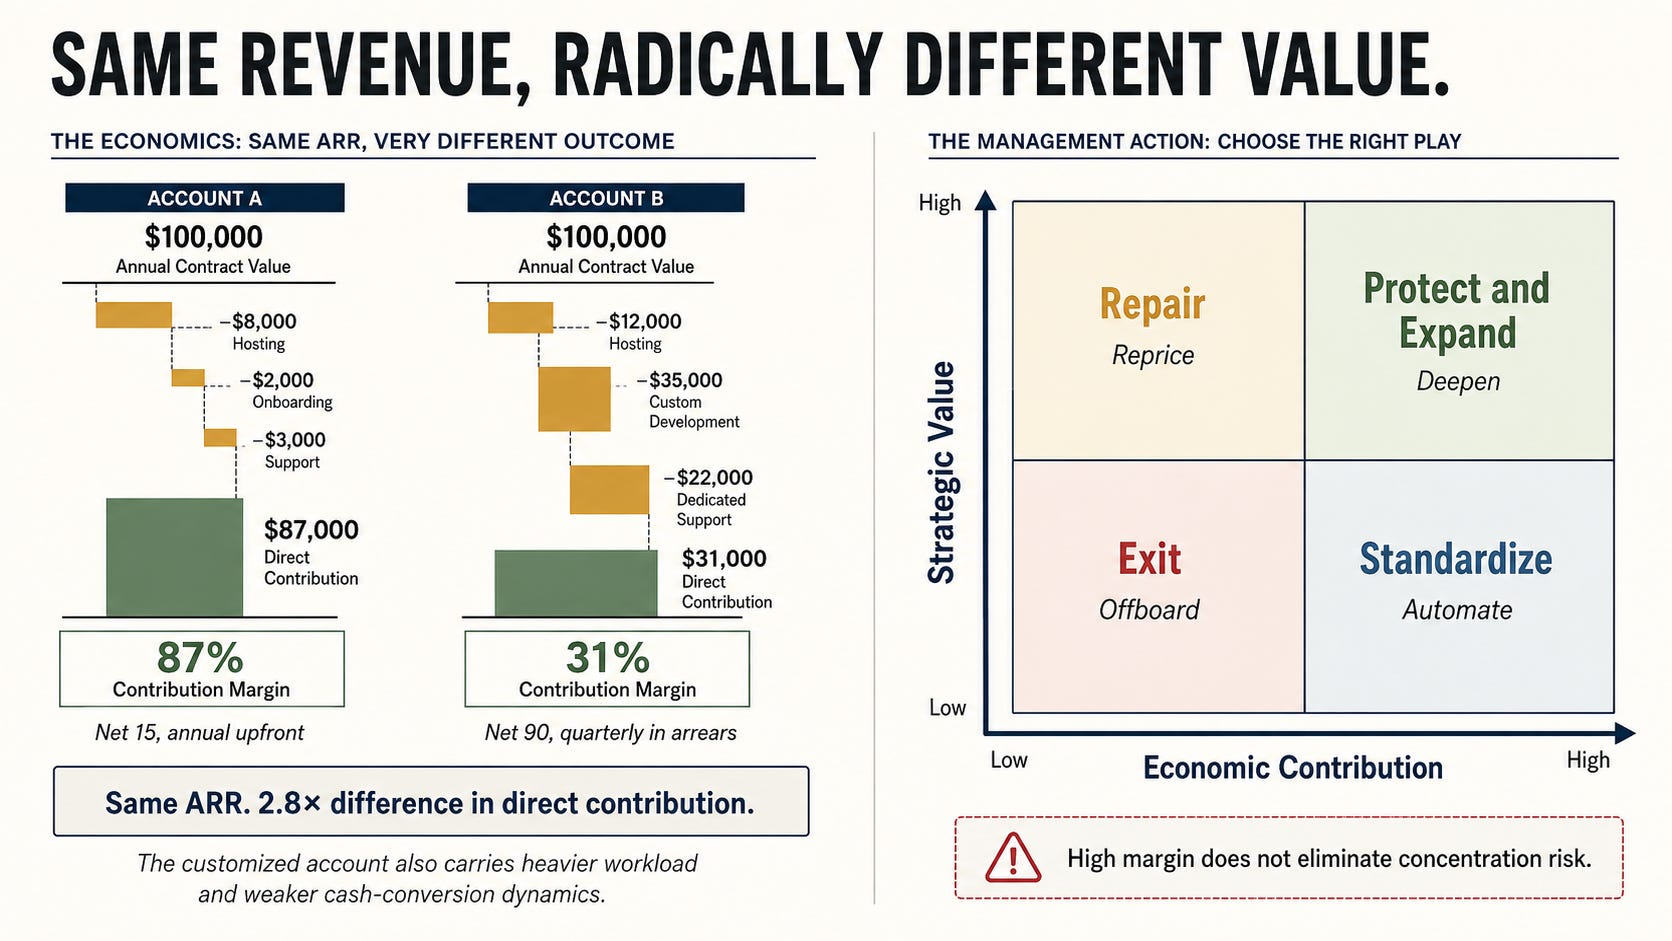
Consider an illustrative comparison between two $100,000 Annual Recurring Revenue customer accounts:
Illustrative model. Assumptions demonstrate the economic mechanism rather than industry benchmarks.
This example isolates direct post-sale contribution and excludes customer acquisition cost. Payment terms affect working capital and liquidity rather than direct contribution margin unless collection or financing costs are explicitly modeled.
In a standard revenue report, the two accounts appear identical. In a properly constructed customer-contribution analysis, Account B produces roughly one-third of the direct contribution under its current contract, while consuming engineering capacity and tying up cash in receivables. That does not necessarily make Account B a bad customer, but it may reveal a bad package, an unmonitored sales promise, or a pricing model that failed to account for operational complexity.
Customer relationships can be organized into four strategic categories:
Protect and Expand: High Strategic Value, High Margin
Prioritize retention, product adoption, and executive sponsorship without creating unnecessary custom delivery. Establish board-level concentration thresholds to prevent single-account exposure.
Standardize: Low Strategic Value, High Margin
Serve these accounts through self-service or standard infrastructure, preserving cash yield without expanding custom support.
Repair: High Strategic Value, Low Margin
These accounts possess observable strategic value, such as verifiable product learning or access to a priority market. Every repair plan should carry a named owner, a target contribution margin, and an explicit expiration date by which the account must reprice, standardize, or transition out.
Exit: Low Strategic Value, Low Margin
These are chronic low-margin and low-alignment accounts whose custom demands permanently exceed their contract value.
Evaluating account quality requires activity-based costing that maps costs directly to the account that generates them. In customer-profitability studies across distribution and service companies, Robert Kaplan and V.G. Narayanan demonstrated that profitable accounts can collectively produce significantly more than 100% of reported profit because losses from unprofitable accounts offset part of their contribution.
The goal of customer cost allocation is not accounting perfection but decision-useful visibility, so costs should be allocated only where the causal relationship is credible.
Customer quality must also account for concentration risk. Consider a company whose largest account represents 35% of revenue. Even if highly profitable, that account carries disproportionate negotiating power and can reduce corporate sovereignty if the relationship sours. Strategic value must also be specific, measurable, transferable beyond the single account, and subject to a defined review period and expiration date.
Internal incentives often preserve bad revenue. No customer-contribution framework will change organizational behavior if sales compensation rewards contract volume over contribution margin, if customer-success targets reward gross retention regardless of delivery cost, or if product teams prioritize individual prestige accounts.
Delivery Economics
Once revenue quality is measured, an organization must control what it costs to fulfill its core value proposition. Labor dependence becomes dangerous when every unit of revenue requires a proportional increase in undifferentiated labor without corresponding gains in price, productivity, specialization, or customer value. Professional services, healthcare, and advisory firms can operate with high labor intensity provided expertise and pricing power rise alongside labor costs.
Redesigning the work must happen before automating it. Deploying artificial intelligence or software automation across an inefficient workflow accelerates the generation of confusion. If a process requires six unnecessary approvals and three duplicated spreadsheets, software simply helps people make bad decisions faster.
When Swedish fintech Klarna deployed an AI assistant that handled two-thirds of its customer-service chats in its first month, company-reported figures provided an early indication of how initial chat throughput can shift. However, assessing sustained economic transformation requires tracking long-term customer satisfaction, escalation rates, repeat contacts, and total operational costs over extended windows. The broader operational lesson is that meaningful savings require more than placing a chatbot in front of an unchanged support queue; the surrounding workflow must be redesigned to eliminate manual steps.
To compress delivery workflows, operators should trace the end-to-end process required to produce a customer outcome and apply four questions:
Can this step be eliminated because it is an organizational artifact rather than a customer or risk requirement?
Can the decision logic be standardized and codified into clear conditional rules?
Can software complete the routine execution reliably?
Where do human judgment, empathy, persuasion, accountability, and high-stakes evaluation justify their labor cost?
Workflow compression should remove delay, duplication, and unnecessary handoffs. It must not be measured solely by headcount reduction, which can erode service quality or institutional knowledge if executed blindly.
These delivery economics extend far beyond software. In heavy manufacturing, industrial distribution, and physical logistics, margin is governed by inventory turns, scrap rates, freight consolidation, and equipment utilization.
Danfoss has described modularity as part of its corporate strategy to reduce product complexity at the core while maintaining configurable offerings at the edge. More broadly, modular industrial design aims to reduce tooling setups, simplify inventory management, and improve factory throughput.
In physical logistics, route density is one of the most important determinants of unit economics. A regional delivery carrier that adds scattered, out-of-route enterprise accounts gains top-line volume, but increases fuel, labor, and vehicle-maintenance costs per package. In every industry, productive scale demands modular delivery: flexibility at the customer edge with standardization wherever variation does not create meaningful customer value.
Demand Economics
After delivery costs are structurally contained, an organization must manage how it acquires and prices its revenue to reduce gatekeeper dependence. This includes mitigating exposure not only to ad auctions, but also to cloud-pricing shifts, app-store commissions, payment rails, and critical-supplier concentration.
Performance marketing trained a generation of executives to value only what could be attributed to an immediate click. That perspective becomes a serious vulnerability when a business relies entirely on rented distribution. Digital ad auctions are efficient markets, but as categories mature, auction pressure and gatekeeper dependence push customer-acquisition costs upward unless stronger conversion, product differentiation, or owned demand offsets them.
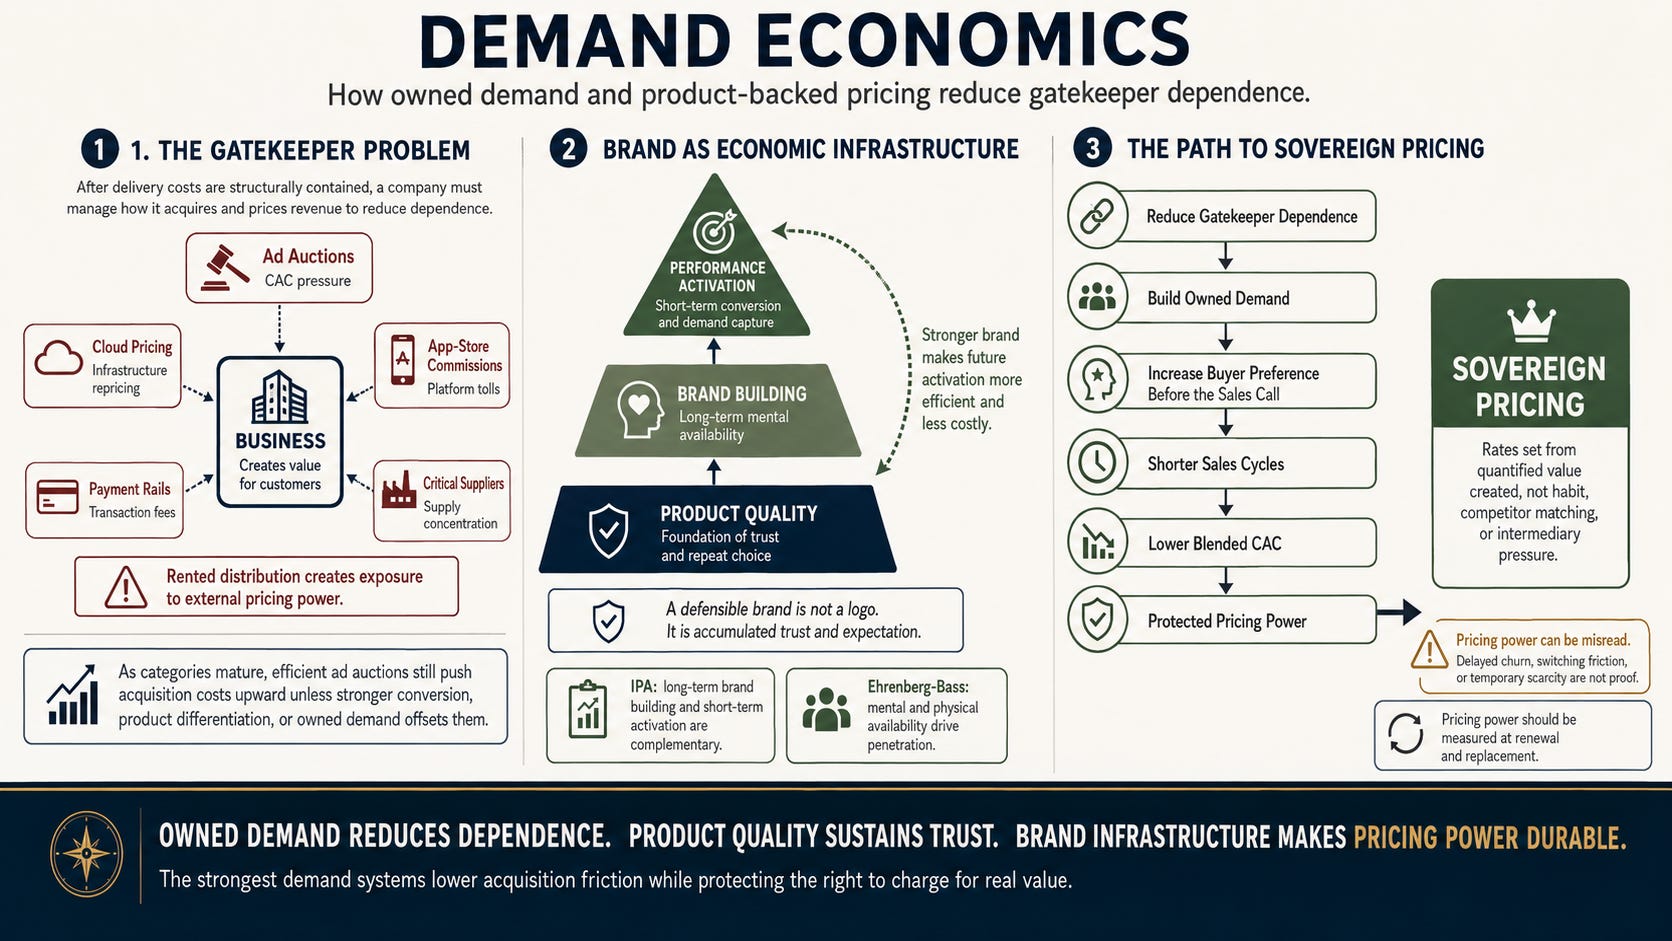
A defensible brand is not a logo or a marketing campaign; brand is economic infrastructure. It is the accumulated trust and expectation that leads a buyer to choose a company before a salesperson opens a presentation deck.
Institute of Practitioners in Advertising effectiveness research has repeatedly demonstrated that long-term brand building and short-term performance activation perform complementary roles. Brand investment builds broad mental availability across a category. Ehrenberg-Bass Institute research similarly emphasizes mental and physical availability as primary drivers of brand penetration. Together, those findings suggest that brand investment can make later performance activation more effective, although results vary across categories.
Product quality remains the foundation of this system. Brand can reduce friction at the point of choice, but sustained pricing power requires the product to continue justifying the expectation.
Apple demonstrates the financial power of an integrated demand system. Counterpoint Research estimated that Apple captured approximately 85% of global smartphone operating profit in the second quarter of 2023, despite holding a much smaller share of unit shipments. Calculated from its reported net sales and cost of sales in financial filings, Apple’s fiscal 2025 results imply a companywide gross margin approaching 47% across hardware and services.
The two statistics cover different periods and metrics, but together they illustrate Apple’s ability to capture disproportionate economic value. Brand pull is only one component of this system, operating alongside custom silicon architecture, proprietary software, retail distribution, supply-chain scale, and an integrated services ecosystem.
A commercially effective brand should ultimately contribute to three concrete economic results: lower blended acquisition costs, shorter sales cycles, and protected pricing power.
Sovereign pricing occurs when a company sets its rates based on the unique, quantified value it creates for the client rather than accepting prices dictated by habit, competitors, or platform intermediaries. True pricing sovereignty requires managing the full pricing architecture: selecting the appropriate value metric, enforcing discount discipline, structuring contract indexation, managing channel commissions, and resisting procurement commoditization.
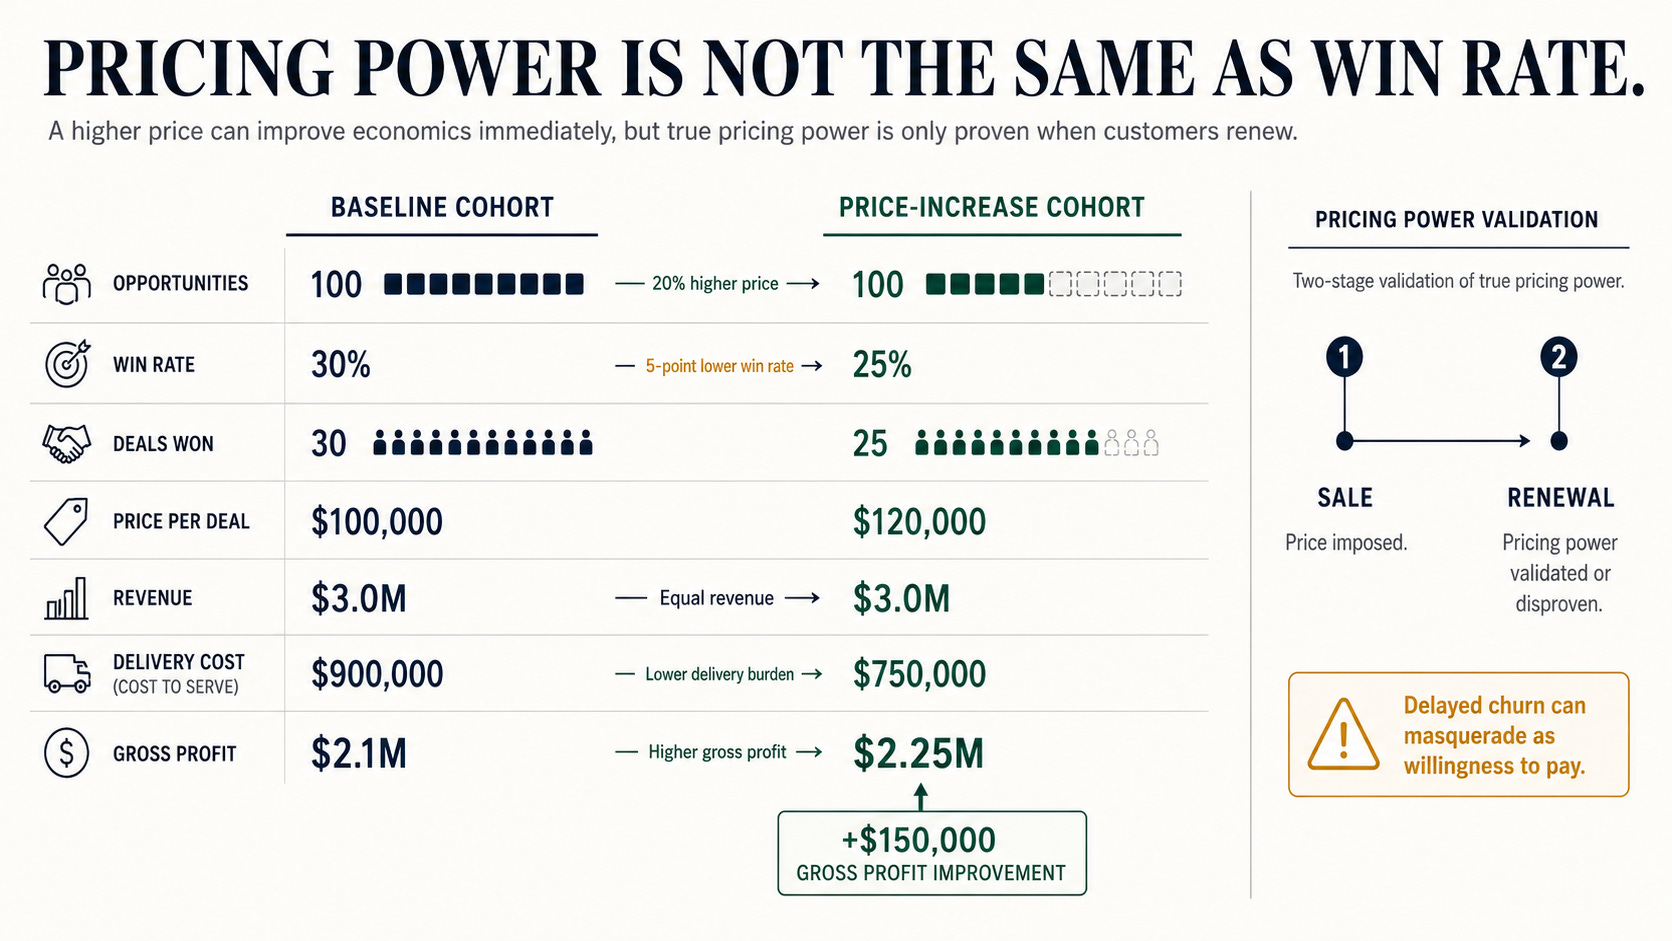
Pricing sovereignty can also be overestimated. A company may discover that what appeared to be genuine willingness to pay was merely switching friction, temporary market scarcity, long-contract lag, or customer inertia. For instance, an illustrative software company raises prices against clients locked into multi-year contracts, mistakes delayed churn for genuine pricing power, and faces accelerated account cancellation at renewal.
Pricing power should be measured at renewal and replacement, not merely at the moment a price increase is imposed. Aggressive pricing without underlying value creation risks accelerating customer churn, inviting regulatory scrutiny, or driving clients toward substitutes.
Pricing Strategies for Uncertain Times
Pricing experiments should be evaluated on overall cohort yield rather than win rates alone. Consider an illustrative case where a firm increases prices by 20% across a new cohort of 100 sales opportunities, moving from a baseline of 30 closed deals at $100,000 to 25 closed deals at $120,000:
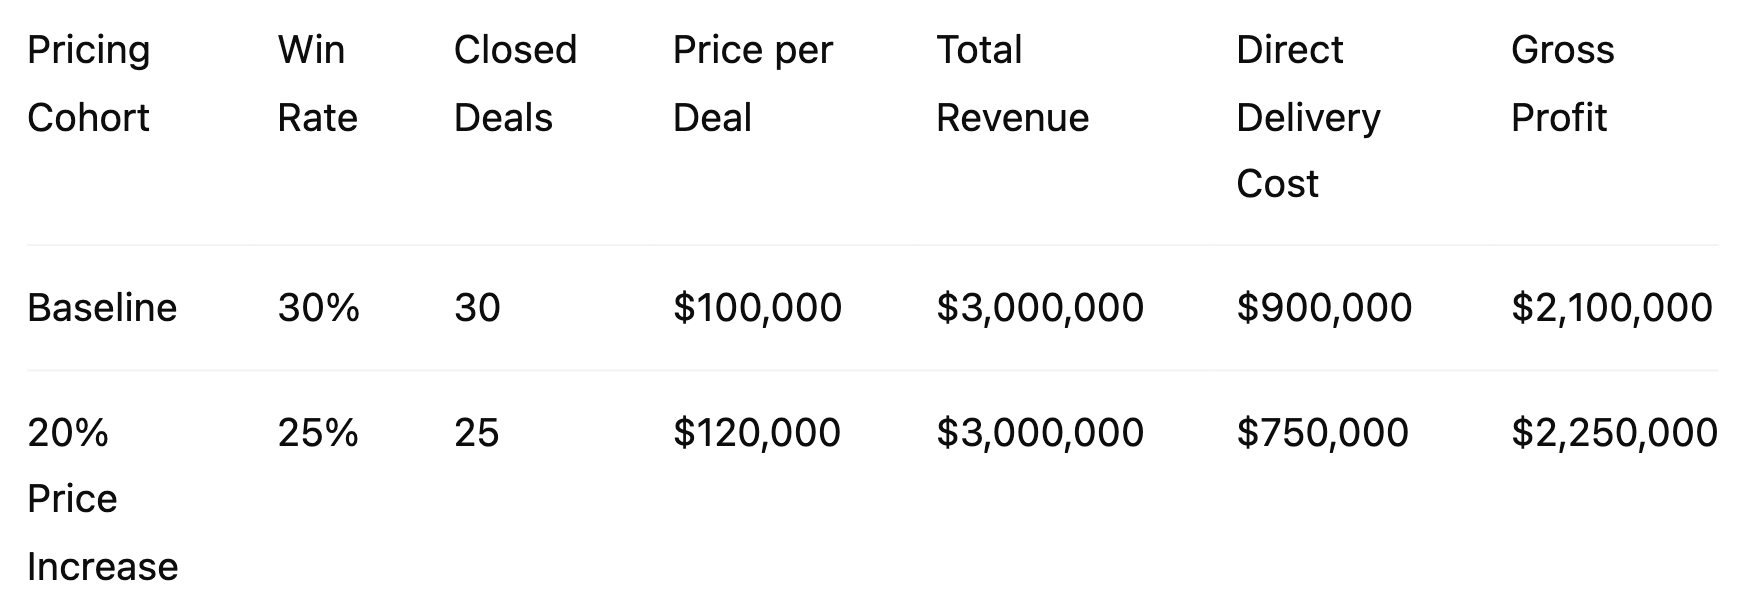
Under these assumptions, revenue remains flat, but direct delivery cost falls by $150,000, lifting gross profit from $2.1 million to $2.25 million across five fewer accounts.
Capital Economics
The financial guardrail of a company is how efficiently management converts capital into cash without weakening its future earning power. Capital sovereignty depends on runway, debt maturity, covenant headroom, cash conversion, and working-capital cycles. In emerging markets, where currency depreciation, import costs, and elevated interest rates create structural volatility, capital efficiency is an immediate operating requirement rather than a distant valuation preference.
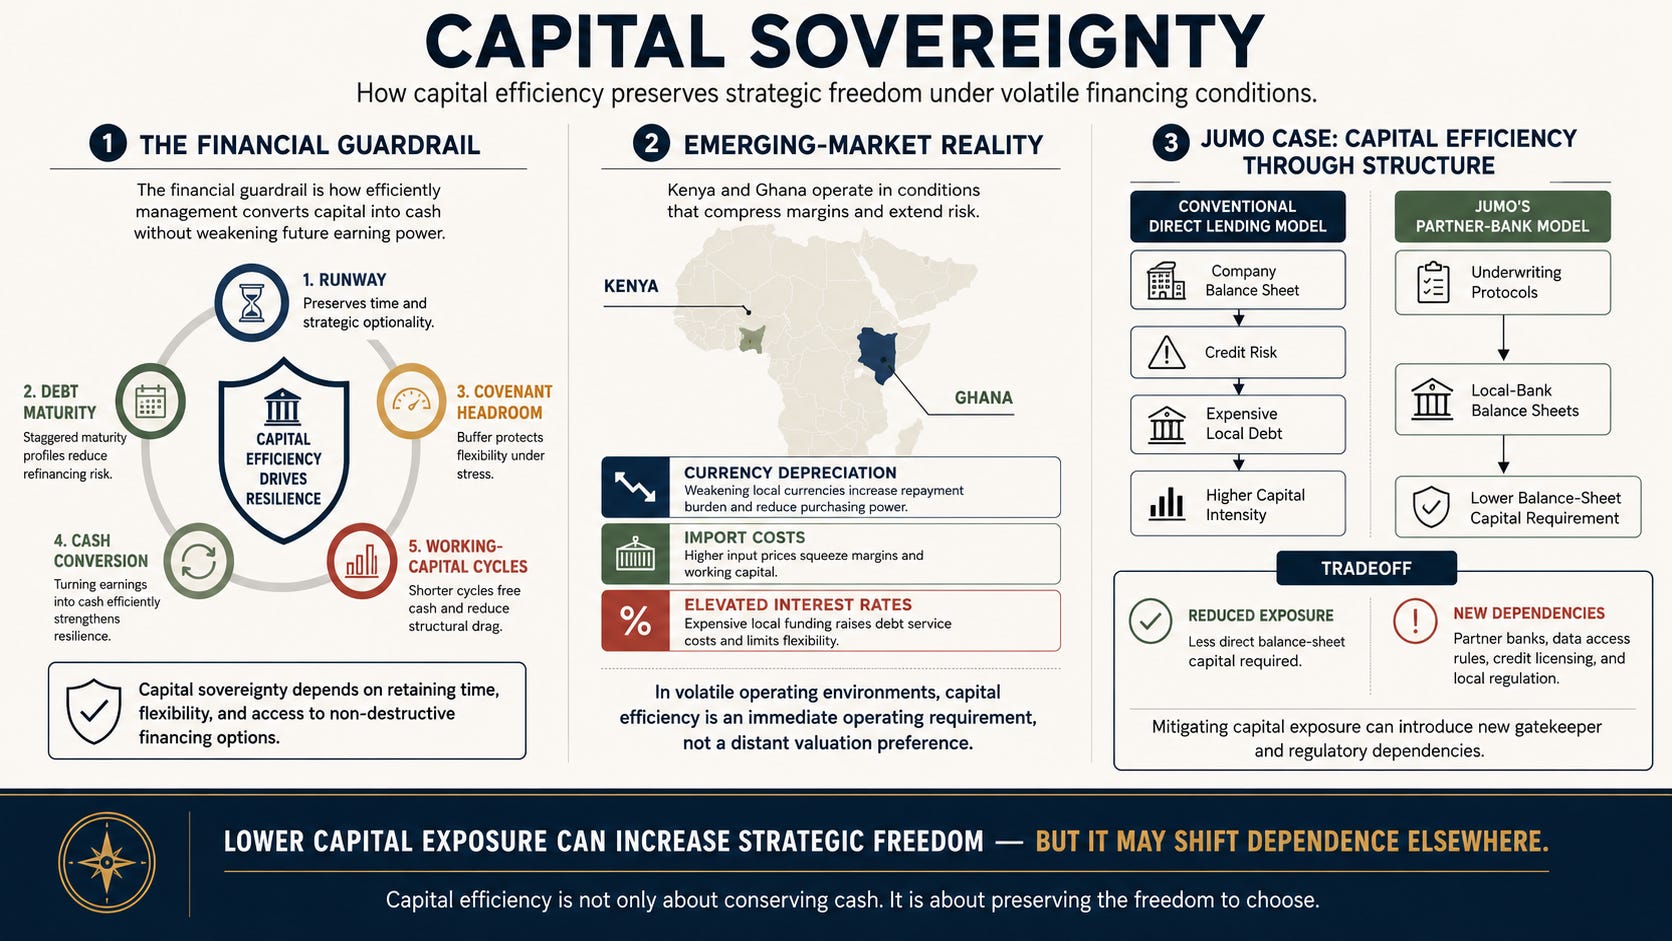
Consider Jumo, a financial-technology company operating across emerging markets such as Kenya and Ghana. Currency pressure and high nominal borrowing rates in specific jurisdictions forced Jumo to design for immediate unit-level capital efficiency. Rather than absorbing credit risk onto its own balance sheet or funding customer acquisition through expensive local debt, Jumo built underwriting protocols paired directly with local-bank balance sheets.
The structure appears to have required less balance-sheet capital than a conventional direct-lending model, although it increased Jumo’s dependence on partner banks and local regulatory frameworks governing data access and credit licensing. Mitigating capital exposure can introduce new gatekeeper and regulatory dependencies.
Sidebar: Two Measures of Growth Efficiency
For cash-consuming recurring-revenue companies, the Burn Multiple, popularized by Craft Ventures, isolates how efficiently management converts burned cash into net new ARR.
Burn Multiple = Net Cash Burn / Net New ARR
A Burn Multiple below 1.0x is often treated as efficient for a growing recurring-revenue company, while a multiple above 2.0x typically warrants investigation into retention, hiring pace, acquisition economics, and investment timing. It is most informative for cash-consuming companies and less relevant once a company is cash-generative.
Customer Acquisition Cost Payback should be calculated using monthly gross-margin contribution rather than top-line revenue.
CAC Payback = Fully Burdened Sales and Marketing CAC / Monthly Gross-Margin Contribution
Monthly Gross-Margin Contribution = Monthly Recurring Revenue × Gross-Margin Percentage
If it costs $12,000 in fully burdened CAC to acquire a customer paying $1,000 per month at a 70% gross margin, monthly gross-margin contribution is $700. The true payback period is 17.1 months.
This metric is useful only when CAC, gross margin, attribution, and cohort timing are defined consistently.
Governance Rule: Metrics used for directional monitoring or operational reviews should not be tied to executive compensation or board scorecards without independent finance validation, cross-functional challenge, gaming-risk assessment, and compensation-committee approval.
How to Calculate Burn Multiple for Startups in 2024 with David Sacks, Craft Ventures
When Margin Defense Becomes Margin Myopia
A management framework that preaches unyielding capital efficiency risks creating its own failure mode: margin myopia.
Margin defense is not an argument for starving research and development, slashing customer service to hit a short-term budget target, or retreating from ambitious opportunities out of fear. Sometimes sovereignty requires paying an optionality premium: holding excess cash, maintaining dual-source suppliers, running redundant infrastructure, or carrying extra inventory that lowers short-term efficiency to protect long-term autonomy.
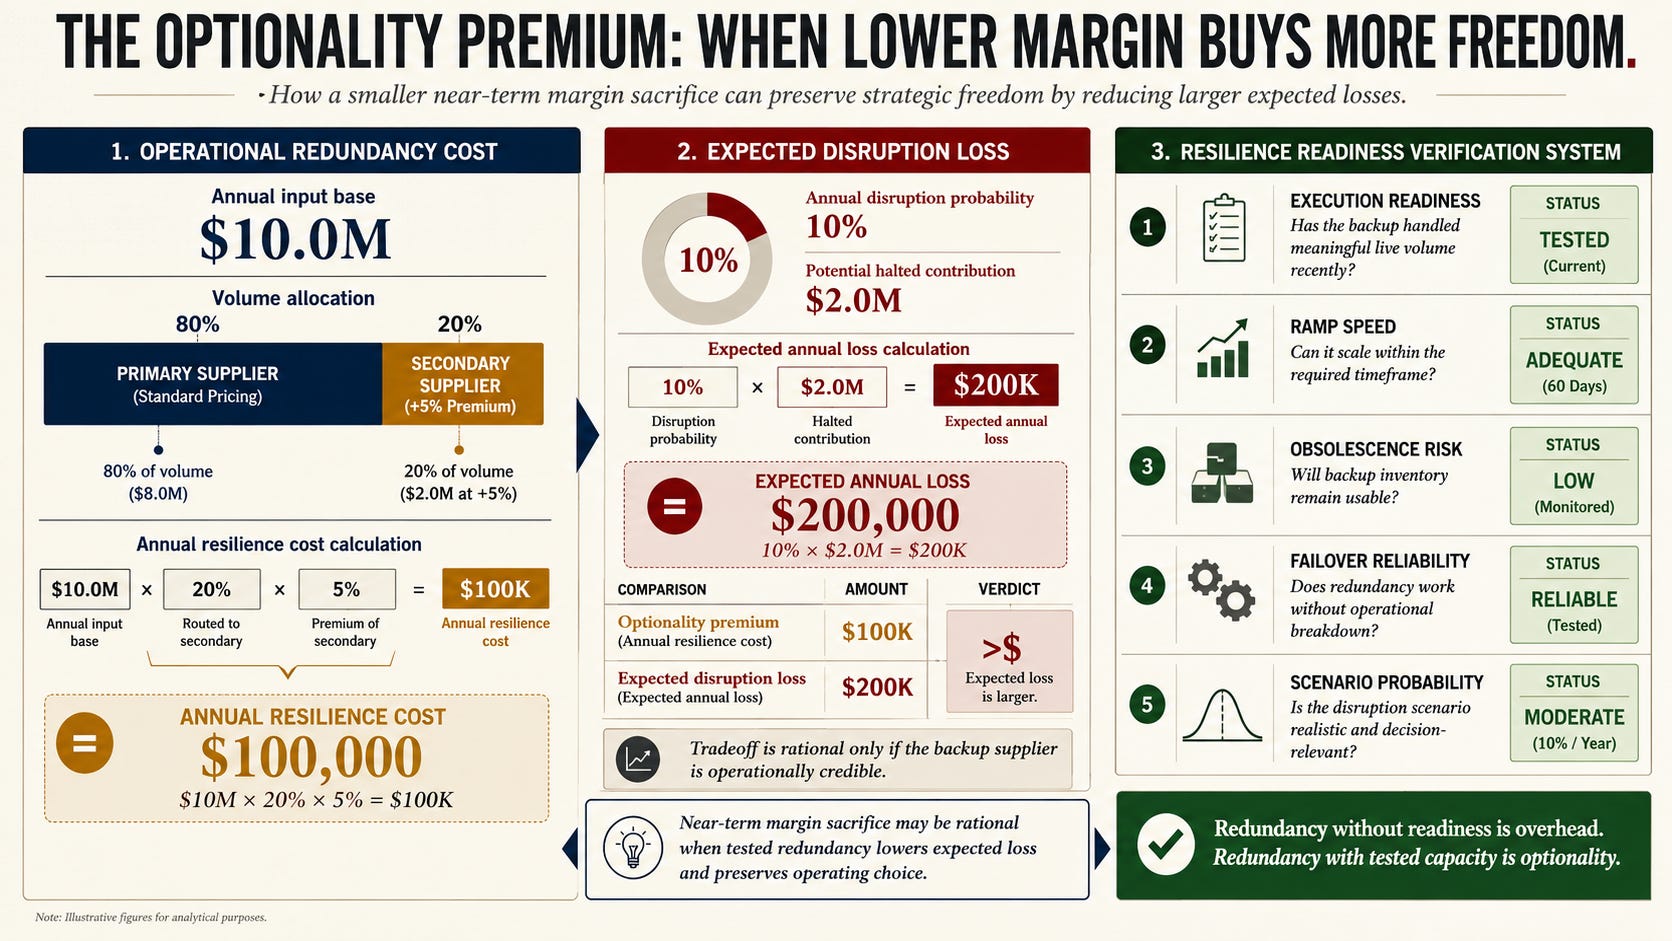
Consider an illustrative dual-sourcing model. A manufacturer purchasing $10 million in primary inputs pays a 5% unit premium on a secondary allocation of 20% of its volume. That equals $100,000 annually.
Sacrificing $100,000 in near-term gross margin lowers immediate capital efficiency. However, under an illustrative assumption of a 10% annual probability of an event that would cost $2 million in halted contribution, the $100,000 annual premium acts as rational insurance. The annual resilience cost is $100,000, compared with an expected annual disruption loss of $200,000.
Illustrative model. Probability and loss assumptions are not industry benchmarks.
In real-world supply chains, such as automotive wiring-harness shortages following geopolitical disruptions, manufacturers with pre-qualified secondary suppliers maintained assembly lines while single-sourced competitors suffered months of halted output.
Resilience spending can also become wasteful if redundant systems are never tested, if duplicate inventory is held without a clear disruption scenario, or if backup suppliers lack actual execution capacity.
To test resilience investments, management should verify five operational conditions:
Execution readiness: Has the backup supplier executed live volume recently enough to demonstrate current operating capacity?
Ramp speed: How many weeks are required for the secondary vendor to scale to the minimum required volume?
Obsolescence risk: Will duplicate inventory remain usable before technical or shelf-life expiration?
Failover reliability: Does redundant infrastructure fail over without manual intervention or data loss?
Scenario probability: What specific disruption is being insured against, and is its probability realistic?
The question is not whether an investment loses money today, but whether scale changes the underlying unit economics tomorrow.
To evaluate whether capital consumption is justified, leadership should test every major growth initiative against five core scale questions:
Threshold: What specific operating milestone or density threshold is the investment trying to cross?
Variable Shift: Which exact unit-economic variable, such as delivery cost per unit, CAC, or customer retention, will improve after the threshold is crossed?
Evidence: What observable metrics show that the company is moving closer to that improvement?
Exit Condition: What predefined underperformance threshold will cause management to discontinue the investment?
Disconfirmation: What specific negative evidence would prove that management’s theory of scale is wrong?
Consider how these questions apply to two well-funded technology ventures evaluated as evidence-limited cases.
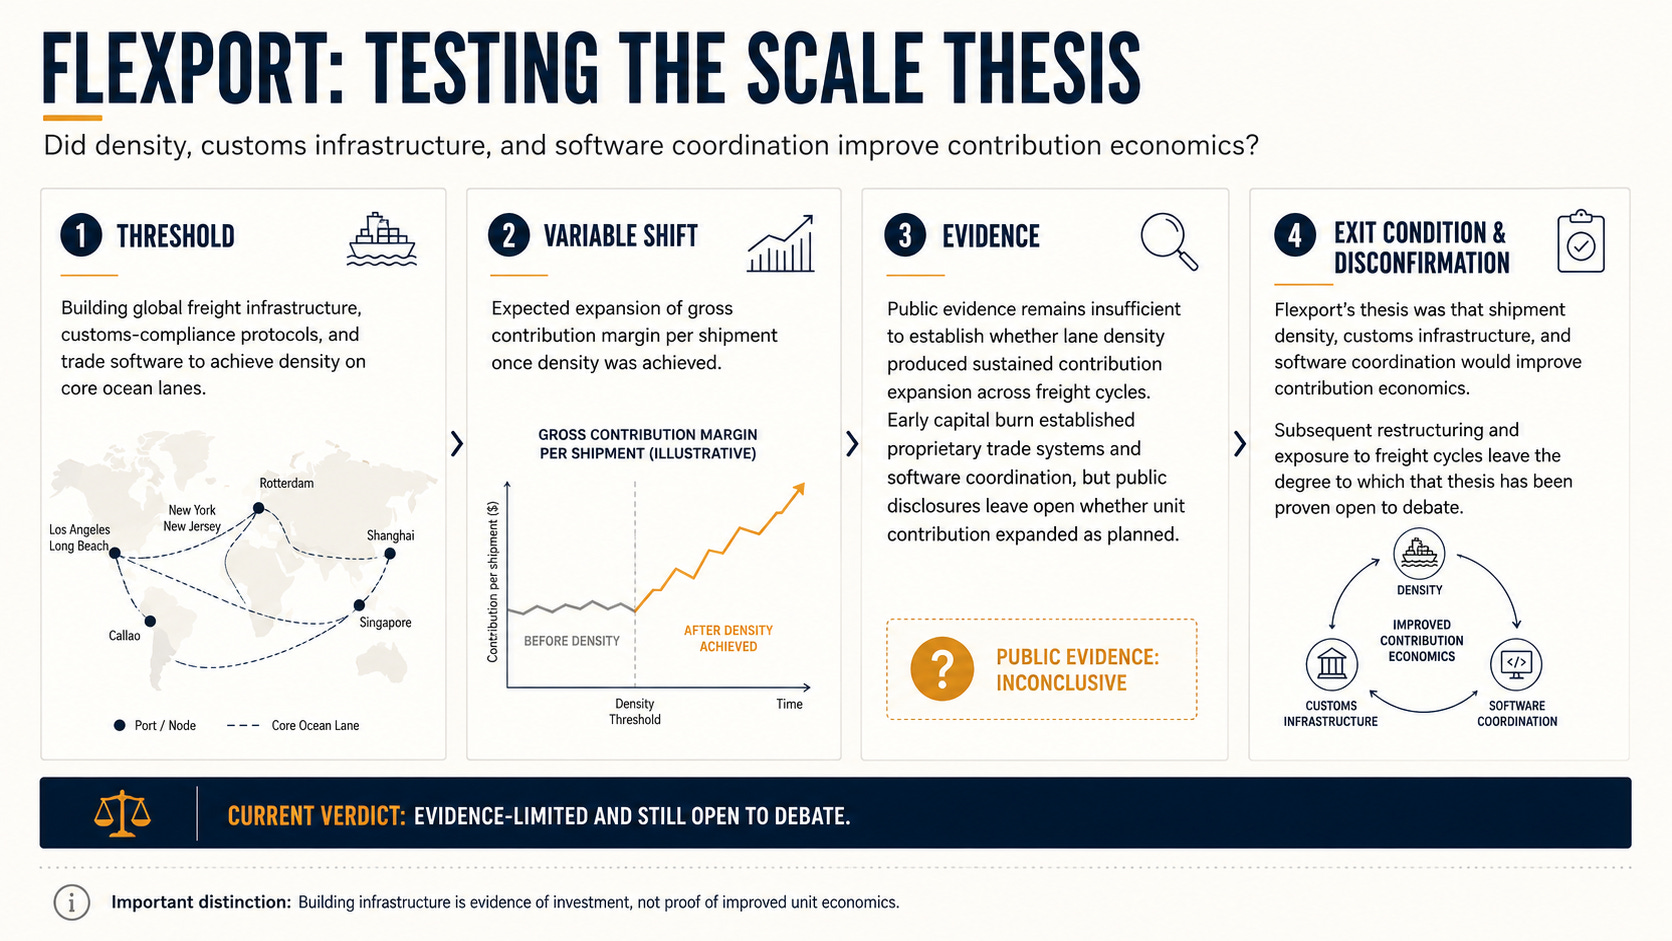
Flexport
Threshold: Building global freight infrastructure, customs-compliance protocols, and trade software to achieve density on core ocean lanes.
Variable Shift: Expected expansion of gross contribution margin per shipment once density was achieved.
Evidence: Public evidence remains insufficient to establish whether lane density produced sustained contribution expansion across freight cycles. Early capital burn established proprietary trade systems and software coordination, but public disclosures leave open whether unit contribution expanded as planned.
Exit Condition and Disconfirmation: Flexport’s thesis was that shipment density, customs infrastructure, and software coordination would improve contribution economics. Subsequent restructuring and exposure to freight cycles leave the degree to which that thesis has been proven open to debate.
Fast
Threshold: Capturing merchant distribution ahead of product scale to establish network effects in one-click checkout.
Variable Shift: Expected decrease in customer-acquisition costs and increase in transaction yield as merchant adoption grew.
Evidence: Available reporting showed limited revenue and merchant adoption relative to Fast’s spending and headcount, leaving little evidence that scale was improving the business before it shut down.
Exit Condition and Disconfirmation: Customer-acquisition costs escalated faster than transaction yield. The loss of external funding determined the timing of the collapse but did not create the underlying unit-economic weakness.
Exit criteria protect capital, but they can also create false negatives when evidence arrives slowly or thresholds are misstated. Conversely, short-term margin improvements can create false positives by disguising deferred hiring, reduced maintenance, or temporary advertising softness.
For instance, an illustrative software company freezes engineering hiring to boost immediate operating margin, only to suffer severe system outages and customer churn six months later. Management should therefore evaluate strategic initiatives along a continuum based on causal clarity, evidence quality, staged commitment, and reversibility rather than treating all capital spending as either pure investment or unmonitored waste.
Sidebar: Close the Loop
After executing any repricing, channel transition, automation program, or financing change, management should conduct a formal post-decision review.
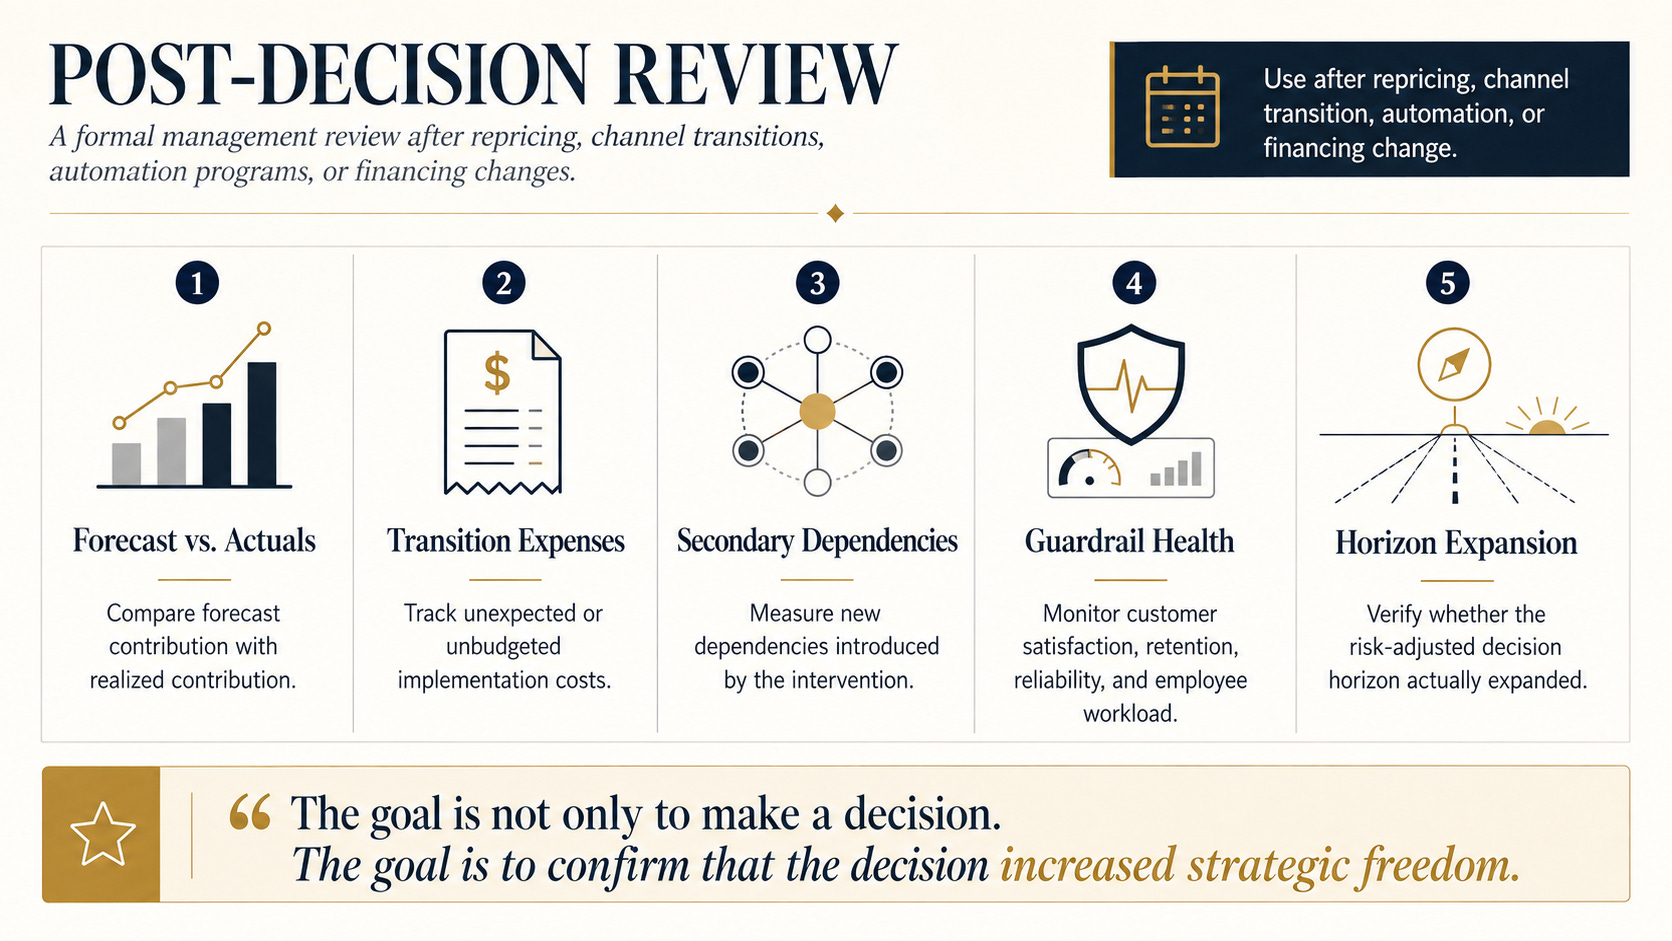
Forecast vs. Actuals: Compare forecast contribution with realized contribution.
Transition Expenses: Track unexpected or unbudgeted implementation costs.
Secondary Dependencies: Measure new dependencies introduced by the intervention.
Guardrail Health: Monitor customer satisfaction, retention, reliability, and employee workload.
Horizon Expansion: Verify whether the risk-adjusted decision horizon actually expanded.
Retaining the Freedom to Choose
Growth creates value when differentiated products, sound unit economics, and durable customers allow scale to reinforce financial strength. Capital efficiency provides resilience during market downturns and fuel during expansions, while sovereign pricing helps a business capture more of the value it creates for customers.
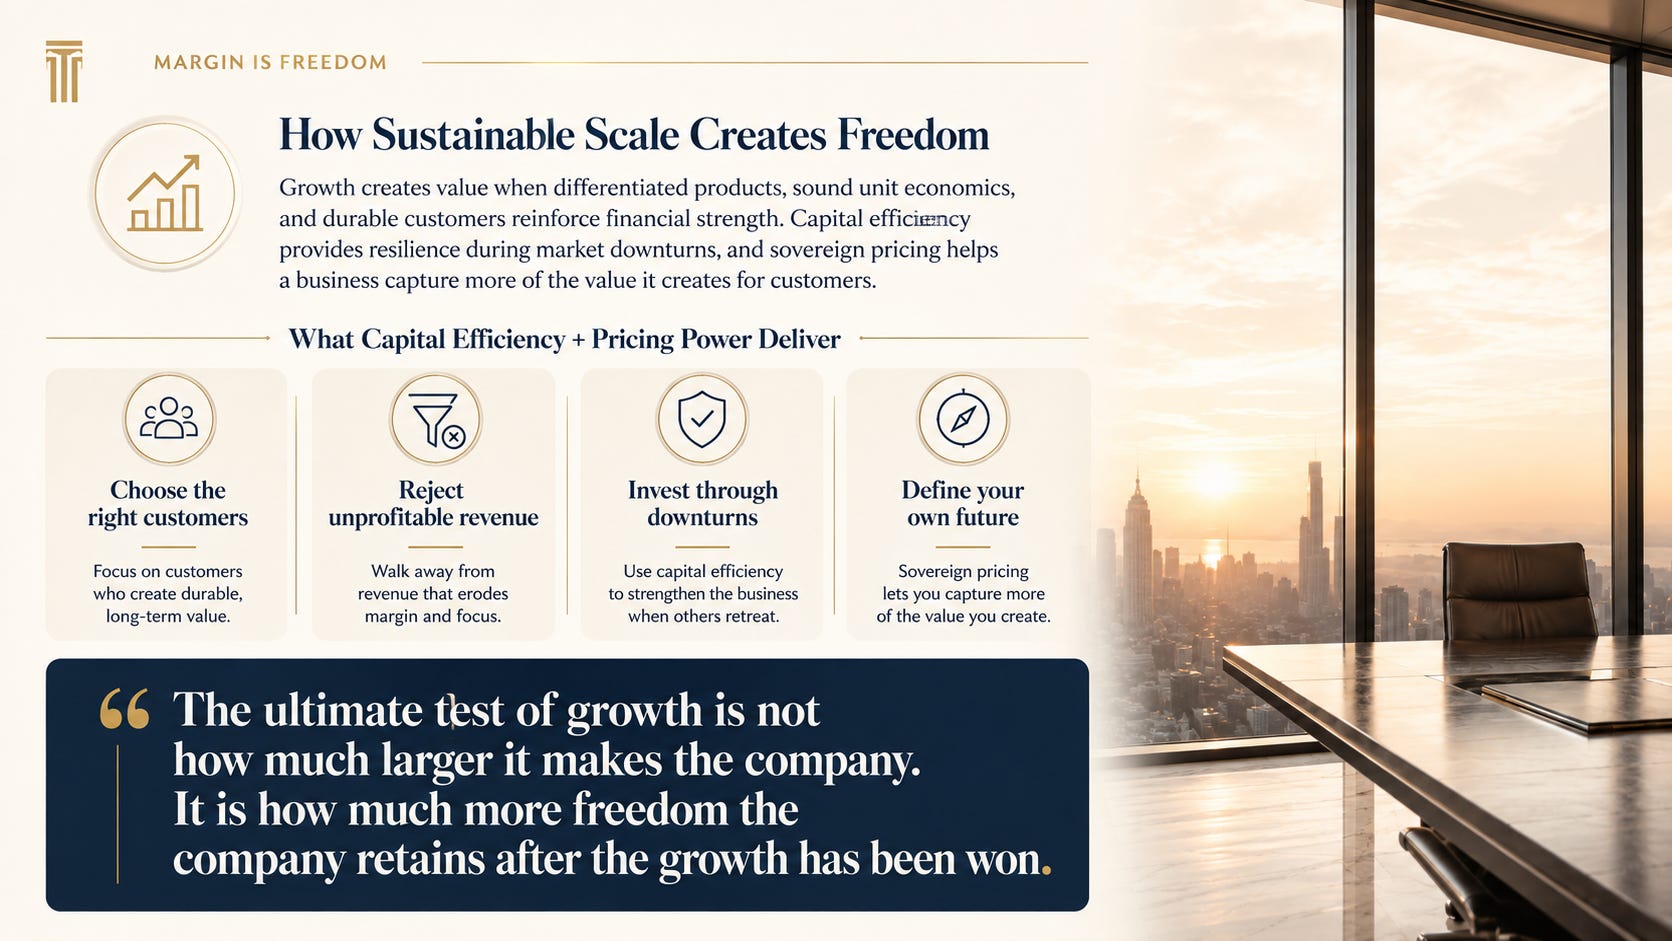
A company that combines capital efficiency with real pricing power gains something far more valuable than a high valuation multiple. It retains the freedom to choose its customers, reject unprofitable revenue, invest through downturns, and define its own future without permission from external capital cycles.
The ultimate test of growth is not how much larger it makes the company. It is how much more freedom the company retains after the growth has been won.
Another great insight, Ken. After more than 30 years of bringing products to market, I have learned that revenue may get attention, but margin keeps the doors open and gives a company choices. Selling more means very little if every sale creates more expense, complexity, and risk.
A healthy margin gives a founder the freedom to improve the product, invest in marketing, survive mistakes, and say no to the wrong opportunities. Growth looks impressive. Profitable growth builds something that can last.